
Many people expected streaming to overtake cable TV soon, although I didn’t expect it to happen in July. However, Nielsen data shows that streaming 34.8% outpaced cable by 0.4% (cable had 34.4% of the total share). The broadcast had a 21.6% share.
Keep in mind that Nielsen only counted TV viewers, not including streaming viewers on smartphones, browsers, and tablets, so the real share of streaming could be much higher, although I can’t say for sure.
Also, It isn’t about the number of viewers or views, as the Nielsen report is based on the time spent watching content.
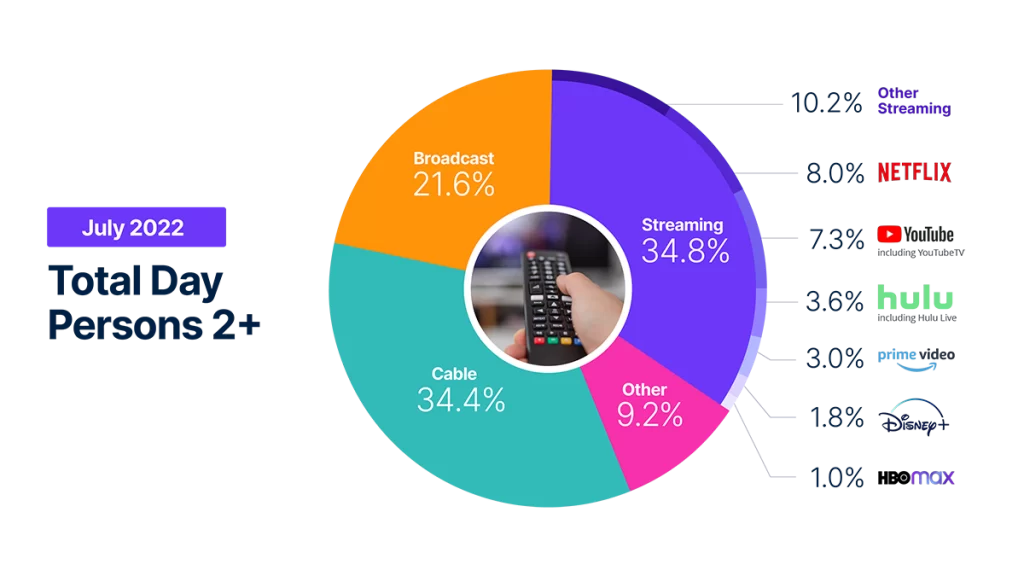
As we can see, among the top 5 streaming services are leading:
- Netflix (8%)
- YouTube+YouTube TV (7.3%)
- Hulu (3.6%)
- Prime Video (3%)
- Disney+ (1.8%)
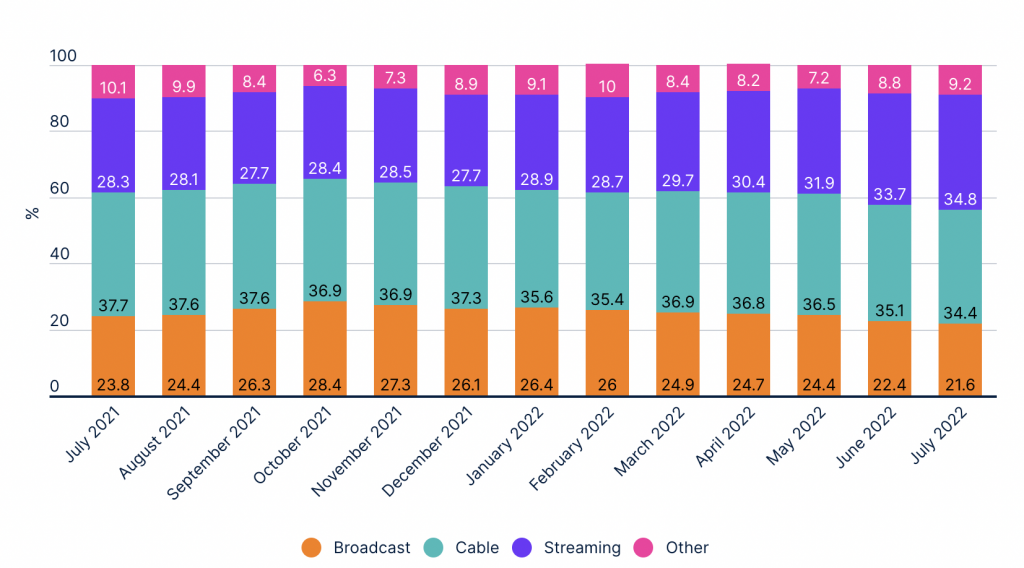
It’s also interesting to look at how the share of different types of content consumption has changed over the year. Streaming is up 6.5% from July 2021. At the same time, cable was down 3.3% over the same period, and broadband was down 2.2%.
According to Conviva, Smart TVs, TVs, and gaming consoles are around 77% of all streaming time. So the rough estimate can be that streaming takes more than 50% of all watching time.


